Table of Contents
jmxstat
| Author | Andy Smith |
|---|---|
| Compatibility | Xymon 4.2,4.3 |
| Requirements | Java 1.5 or above and jmxsh (http://code.google.com/p/jmxsh/) |
| Download | jmxstat_kit.zip |
| Last Update | 2017-11-17 |
Description
This is a tcl script that runs under jmxsh to connect to a JMX enabled JVM, extract stats and send to Xymon. It currently monitors Tomcat on a variety of UNIX, Linux and Windows servers. It is modeled on the beastat.pl monitor for Weblogic (http://sourceforge.net/projects/hobbit-perl-cl) but jmxstat should work for any JVM that exposes the JMX interface, especially Tomcat, but also JBoss and Weblogic. The jmxstat monitor provides the same reporting and alerting facilities as beastat and is configured in a very similar way so anyone familiar with beastat should be comfortable with the installation.
jmxstat is expected to run as a 'traditional' extension and makes use of a communications program provided with the local Xymon agent such as xymon, xymon.ps1 or BBWinCMD.exe to deliver the updates to the central Xymon server. See the README in the zipfile for discussion of the implementation differences between UNIX/Linux and Windows agents.
Installation
Client side
1. Copy the 3 files jmxsh-R5.jar, jmxstat.tcl and jmxstat.sh to the Xymon extensions directory $XYMONHOME/ext
2. Rename jmxstat_sample.ini to jmxstat.ini and copy it to the Xymon config directory $XYMONHOME/etc
3. Edit $XYMONHOME/etc/jmxstat.ini, as a minimum you will need to modify the following in the default section :-
  adminport
  username
  password
- These define the credentials to allow xymon to contact the JVM. The JVM will need to be restarted with additional options that enable the JMX module and define the port & credentials.
- The sample ini file contains definitions for generic and Tomcat (Catalina) Mbeans, definitions for JBoss Mbeans is work in progress and will be added to the sample ini in due course. If anyone has any contributions for the defaults then please let me know.
4. Add entries to the hosts.cfg file (create one if none exists in your Xymon installation) [NOT required on Windows Clients]
0.0.0.0 some_unique_name_in_xymon_space # noconn jmxstat
5. Edit the $XYMONHOME/etc/clientlaunch.cfg and insert the following text: [Windows Clients handle this differently - see README]
 [jmxstat]
      #DISABLED
      ENVFILE /apps/xymon/client/etc/xymonclient.cfg
      CMD $XYMONHOME/ext/jmxstat.sh
      LOGFILE $XYMONCLIENTLOGS/jmxstat.log
      INTERVAL 5m
Server side
- The jmxstat.ini file on the client side enables you to specify and collect any attributes from arbitary MBeans, but the server needs to be configured to display the RRD files that will be generated by 7 pre-configured MBeans which you might choose to retain from the sample jmxstat.ini.
6. Add this to TEST2RRD= in xymonserver.cfg
Threads=ncv,JVMHeap=ncv,Classes=ncv,WebApp=ncv,ThreadPool=ncv,Service=ncv,GCInfo,jmxstat
7. Add this to GRAPHS= in xymonserver.cfg
Threads,Classes,Service,JVMHeap,GCInfo,WebApp,ThreadPool,jmxstat
8. Add these 7 extra lines to xymonserver.cfg
NCV_Threads="LiveThreads:GAUGE,Peak:GAUGE,DaemonThreads:GAUGE,Total:DERIVE"
NCV_JVMHeap="HeapSize:GAUGE,Committed:GAUGE,MaxHeapSize:GAUGE"
NCV_Classes="Classes:GAUGE"
NCV_WebApp="activeSessions:GAUGE,sessionCounter:GAUGE,maxActive:GAUGE,sessionMaxAliveTime:GAUGE,sessionAverageAlive:GAUGE,rejectedSessions:GAUGE,expiredSessions:GAUGE"
NCV_ThreadPool="currentThreadCount:GAUGE,currentThreadsBusy:GAUGE"
NCV_Service="bytesReceived:DERIVE,bytesSent:DERIVE,errorCount:DERIVE,requestCount:DERIVE"
NCV_jmxstat="runtime:GAUGE"
9. Add these 8 new sections to graphs.cfg
[Threads]
# java.lang:type=Threading
TITLE Java Resources
YAXIS Threads
DEF:Lve=Threads.rrd:LiveThreads:AVERAGE
DEF:Pek=Threads.rrd:Peak:AVERAGE
DEF:r=Threads.rrd:Total:AVERAGE
CDEF:Tot=r,60,*
LINE2:Lve#00CCCC:Live Threads
LINE2:Tot#FF0000:New Threads
COMMENT:\n
GPRINT:Lve:LAST:Current Threads \: %5.1lf%s (cur)
GPRINT:Lve:MAX: \: %5.1lf%s (max)
GPRINT:Lve:MIN: \: %5.1lf%s (min)
GPRINT:Lve:AVERAGE: \: %5.1lf%s (avg)\n
GPRINT:Tot:LAST:New Threads/min \: %5.1lf%s (cur)
GPRINT:Tot:MAX: \: %5.1lf%s (max)\n
[Classes]
#java.lang:type=ClassLoading
TITLE Java Resources
YAXIS Classes
DEF:count=Classes.rrd:Classes:AVERAGE
LINE2:count#00CCCC:Classes Loaded
GPRINT:count:LAST: %6.1lf (cur) \:
GPRINT:count:MAX: %6.1lf (max) \:
GPRINT:count:MIN: %6.1lf (min) \:
GPRINT:count:AVERAGE: %6.1lf (avg)\n
[Service]
# Catalina:type=GlobalRequestProcessor,name=http-8080
TITLE Java Resources
YAXIS Requests/sec
DEF:in=Service.rrd:bytesReceived:AVERAGE
DEF:out=Service.rrd:bytesSent:AVERAGE
DEF:r=Service.rrd:requestCount:AVERAGE
CDEF:req=r,1,*
-X0
LINE2:req#FF0000:Requests
COMMENT:\n
GPRINT:req:LAST:Requests/s \: %5.1lf%s (cur)
GPRINT:req:MAX: \: %5.1lf%s (max)
GPRINT:req:AVERAGE: \: %5.1lf%s (avg)\n
GPRINT:in:LAST:Received bytes/s\: %5.1lf%s (cur)
GPRINT:in:MAX: \: %5.1lf%s (max)
GPRINT:in:AVERAGE: \: %5.1lf%s (avg)\n
GPRINT:out:LAST:Sent bytes/s\: %5.1lf%s (cur)
GPRINT:out:MAX: \: %5.1lf%s (max)
GPRINT:out:AVERAGE: \: %5.1lf%s (avg)\n
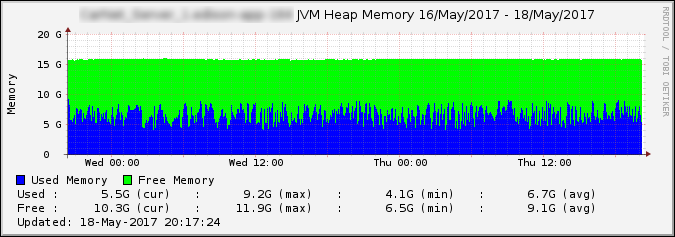
[JVMHeap]
TITLE JVM Heap Memory
YAXIS Memory
DEF:kused=JVMHeap.rrd:HeapSize:AVERAGE
DEF:ktotal=JVMHeap.rrd:Committed:AVERAGE
CDEF:bused=kused,1024,*
CDEF:btotal=ktotal,1024,*
CDEF:free=btotal,bused,-
CDEF:used=bused
-l 0
-b 1024
AREA:used#0000FF:Used Memory
AREA:free#00FF00:Free Memory:STACK
COMMENT:\n
GPRINT:used:LAST:Used \: %8.1lf%s (cur)
GPRINT:used:MAX: \: %8.1lf%s (max)
GPRINT:used:MIN: \: %8.1lf%s (min)
GPRINT:used:AVERAGE: \: %8.1lf%s (avg)\n
GPRINT:free:LAST:Free \: %8.1lf%s (cur)
GPRINT:free:MAX: \: %8.1lf%s (max)
GPRINT:free:MIN: \: %8.1lf%s (min)
GPRINT:free:AVERAGE: \: %8.1lf%s (avg)\n
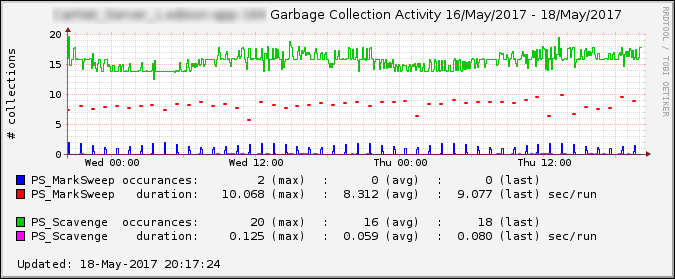
[GCInfo]
TITLE Garbage Collection Activity
YAXIS # collections
FNPATTERN GCInfo.(.+).rrd
DEF:r@RRDIDX@=@RRDFN@:CollectionCount:AVERAGE:step=300
DEF:t@RRDIDX@=@RRDFN@:CollectionTime:AVERAGE:step=300
CDEF:count@RRDIDX@=r@RRDIDX@,600,*
CDEF:duration@RRDIDX@=t@RRDIDX@,600,*,1000,/,count@RRDIDX@,/
LINE1:count@RRDIDX@#@COLOR@:@RRDPARAM@ occurances\:
-X0
GPRINT:count@RRDIDX@:MAX: %6.0lf (max)
GPRINT:count@RRDIDX@:AVERAGE:\: %6.0lf (avg)
GPRINT:count@RRDIDX@:LAST:\: %6.0lf (last)\n
LINE2:duration@RRDIDX@#@COLOR@:@RRDPARAM@ duration\:
GPRINT:duration@RRDIDX@:MAX: %6.3lf (max)
GPRINT:duration@RRDIDX@:AVERAGE:\: %6.3lf (avg)
GPRINT:duration@RRDIDX@:LAST:\: %6.3lf (last) sec/run\n
COMMENT: \n
[WebApp]
# Catalina:type=Manager,path=/arsys,host=localhost
TITLE WebApp Usage
YAXIS Sessions
DEF:cur=WebApp.rrd:activeSessions:AVERAGE
DEF:r=WebApp.rrd:sessionCounter:AVERAGE
CDEF:new=r,60,*
LINE2:cur#00FF00:Current Sessions
COMMENT:\n
GPRINT:cur:LAST:Sessions \: %5.1lf%s (cur)
GPRINT:cur:MAX: \: %5.1lf%s (max)
GPRINT:cur:MIN: \: %5.1lf%s (min)
GPRINT:cur:AVERAGE: \: %5.1lf%s (avg)\n
GPRINT:new:LAST:New Sessions/min\: %5.1lf%s (cur)
GPRINT:new:MAX: \: %5.1lf%s (max)
GPRINT:new:AVERAGE: \: %5.1lf%s (avg)\n
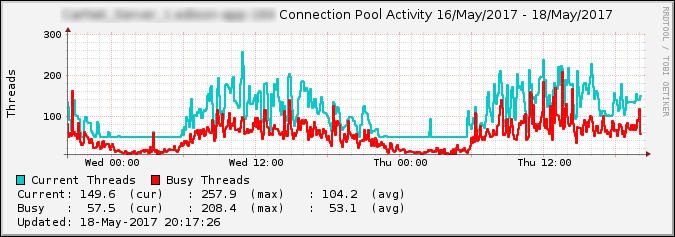
[ThreadPool]
#Catalina:type=ThreadPool,name=http-8080
TITLE WebApp Usage
YAXIS Thread Pool
DEF:count=ThreadPool.rrd:currentThreadCount:AVERAGE
DEF:active=ThreadPool.rrd:currentThreadsBusy:AVERAGE
LINE2:count#00CCCC:Current Threads
LINE2:active#FF0000:Busy Threads
COMMENT:\n
GPRINT:count:LAST:Current\: %5.1lf%s (cur)
GPRINT:count:MAX: \: %5.1lf%s (max)
GPRINT:count:AVERAGE: \: %5.1lf%s (avg)\n
GPRINT:active:LAST:Busy \: %5.1lf%s (cur)
GPRINT:active:MAX: \: %5.1lf%s (max)
GPRINT:active:AVERAGE: \: %5.1lf%s (avg)\n
[jmxstat]
TITLE jmxstat Run Time
YAXIS Seconds
DEF:rt=jmxstat.rrd:runtime:AVERAGE
AREA:rt#00CCCC:Run Time
COMMENT:\n
GPRINT:rt:LAST: \: %5.1lf (cur)
GPRINT:rt:MAX: \: %5.1lf (max)
GPRINT:rt:MIN: \: %5.1lf (min)
GPRINT:rt:AVERAGE: \: %5.1lf (avg)\n
10. This step is not needed if you have the zonestat or mpstat monitor installed.
- The following text is copied from the pages for zonestat/mpstat. If you dont already have rrd_data.pl you can find a copy of that script on those pages. Note there is an addition to be made to the rrd_data.pl script.
- Xymon supports only 1 data reader on the server. To make it as configurable as possible (we use multiple items to send stats too). Perl was used to help make it quicker. Inside the script has the graph definitions as well. You will have to add the information as documented below to the [rrddata] section to the tasks.cfg file. Modify the tasks.cfg file on the server under the rrddata section (add the –extra-tests and –extra-script segments):
# "rrddata" updates RRD files with information that arrives as "data" messages.
# If you want RRD graphs of your monitoring BB data, then you want to run this.

[rrddata]
    ENVFILE /home/xymon/server/etc/xymonserver.cfg
    NEEDS xymond
    CMD xymond_channel --channel=data
           --log=$XYMONSERVERLOGS/rrd-data.log xymond_rrd
           --extra-tests=mpstat,zonestat,GCInfo
           --extra-script=/home/xymon/server/ext/rrd_data.pl
           --rrddir=$XYMONVAR/rrd
11. Add the following to your copy of rrd_data.pl
} elsif ( $testname eq "GCInfo" ) {
##
## Reads in the jmxstat.tcl from client
##
   if ( defined($buffer{"GarbageCollectors"}) ) {
      @loop=split(' ',$buffer{"GarbageCollectors"});

      print "DS:CollectionCount:DERIVE:600:0:U\n";
      print "DS:CollectionTime:DERIVE:600:0:U\n";

      foreach $key ( @loop ) {
         undef(@line);
         push(@line,$buffer{"${key}CollectionCount"});
         push(@line,$buffer{"${key}CollectionTime"});

         $tmp = (split('/',$key))[1];
         print "$testname.${key}.rrd\n";
         $line=join(':',@line);
         print "$line\n";
      }

   }
}
Source
jmxstat.tcl
The tcl code on its own is quite substantial (2000 lines or so) but in order to be somewhat independent of the local environment, I have included code from tclib, so the whole script is 6000 lines or so, too much to paste onto this page. I have created an archive of the various materials which you can fetch from the download URL above.
Known Bugs and Issues
limited error processing when bb (or bbwincmd) command fails.limited error processing when attributes return unexpected results.- RRD data files with ds types of DERIVE are created on my server with 'minimum' unspecified. This means that for instance, when a JVM is restarted the new request rate is calculated incorrectly. YMMV. This behaviour can be fixed by using rdtune after the RRD file is created to set the minimum to 0, eg
- rrdtool tune /var/lib/xymon/rrd/test_jvm/Service.rrd –minimum bytesReceived:0
- rrdtool tune /var/lib/xymon/rrd/test_jvm/Service.rrd –minimum bytesSent:0
- rrdtool tune /var/lib/xymon/rrd/test_jvm/Service.rrd –minimum requestCount:0
- rrdtool tune /var/lib/xymon/rrd/test_jvm/Service.rrd –minimum errorCount:0
- rrdtool tune /var/lib/xymon/rrd/test_jvm/Threads.rrd –minimum Total:0
To Do
- replace relience on external commands for communication with native tcl networking code
Credits
- Francesco Duranti for inspiration from beastat
- Robert Cabacungan for the jmxsh utility
Changelog
- 2017-11-17 v 0.1.12
- Support for WinPSClient in query_bb, send_bb and send_bb_data.
- Bug fix: uninitialized string in query_bb for BBWin.
- Strategy for no-update (-n) no longer via /bin/echo or ECHO.EXE.
- Client Agent name added to jmxstat report.
- Support for not performing a connectivity test for individual jvms.
- Automatically and portably derives XYMONHOME if not in environment.
- Implemented a built-in xymongrep for platforms without one.
- Generalized command (CMD) in query_bb, send_bb, send_bb_data.
- Replaced quotation characters in MSG in send_bb and send_bb_data.
- 2016-09-07 v 0.1.9
- XYMONNETWORK removed for xymongrep
- 2015-02-28 v 0.1.8
- re-work of 0.1.5 using MBEAN and ATTROP.
- New keyword “conntest” added to ini file.
- Runtime rrd info sent.
- 2014-08-07 v 0.1.7
- pre and post exec options to allow writing your own tcl miniprograms
- 2014-04-08 v 0.1.6
- arithmetic in GCInfo sizes.
- 2013-03-07 v 0.1.5
- put \“ wrapper around mbean args to jmx_get.
- cater for jvm not providing maxSpareThreads.
- adapt to change in behaviour of xymongrep.
- 2012-09-15 v 0.1.4
- caught some uninitialized variables.
- better debugging.
- 2011-11-11 v 0.1.3
- Support for Xymon 4.3.
- better error checking around jmx_get.
- proper flow control around down/unresponsive hosts.
- 2011-07-08 v 0.1.2
- deal with gc collectors that lie about number of collections.
- Corrections for integer arithmetic in Heap sizes.
- 2011-07-03 v 0.1.1
- dont report old gcinfo alerts.
- 2011-03-23 v 0.1.0
- Initial release